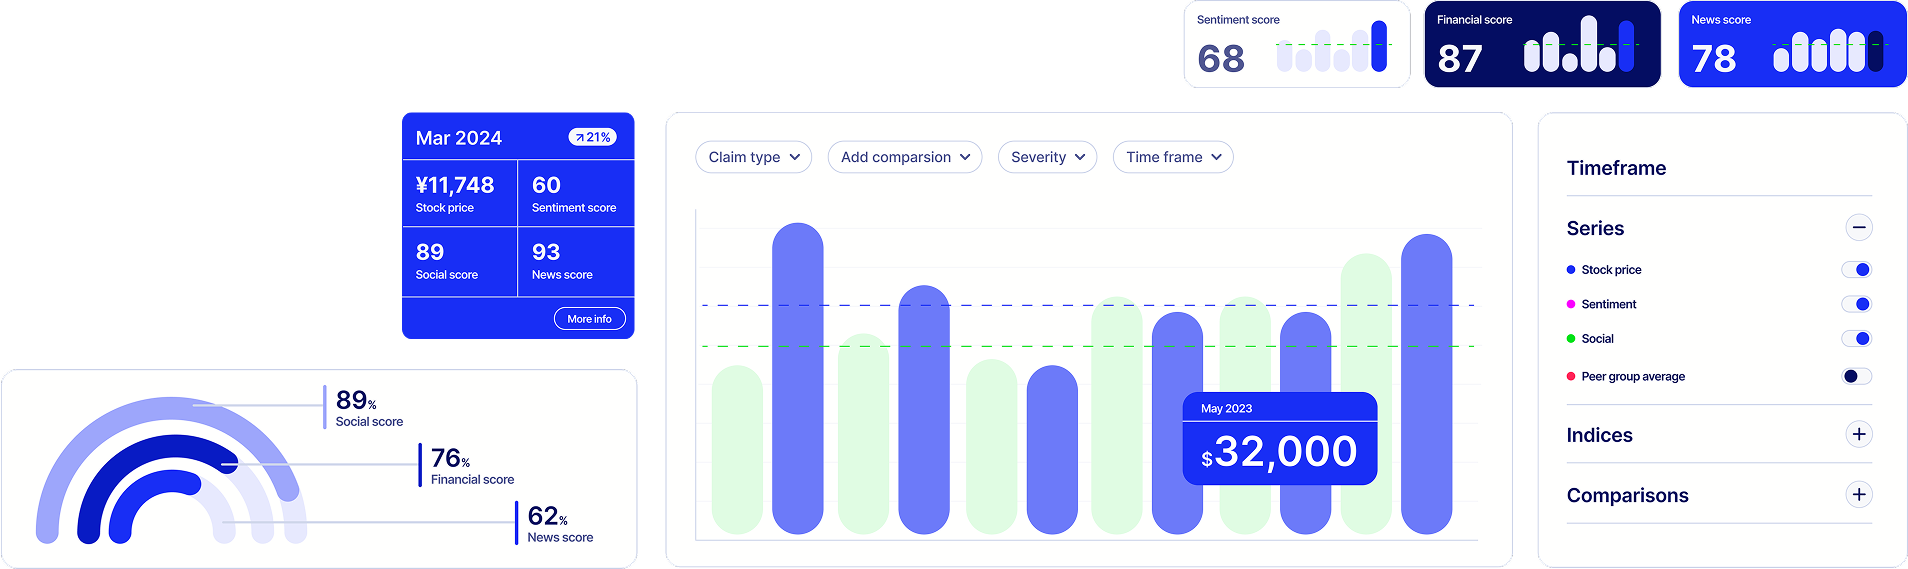
A powerful dashboard presenting real-time portfolio insights, live risks and policy breaches, to help insurers make smarter, data-driven decisions in minutes.
Role
Sole UX and UI Designer
INDUSTRY
Insurance
Company
MS Amlin

The marine insurance industry is worth over £33 billion globally, with the Lloyds market taking a prioritised interest in it. There are thousands of data points and sources available to provide rich analysis, should they be utilised in the right way.
I held a workshop with an underwriting assistant to understand what their needs are for the project, revealing the following:
Underwriters insure various fleets of vessels that make up their portfolio. They have access to tools that allow them to view information about an individual vessel, but these tools do not extend to showing how this one vessel affects the risk profile of a wider portfolio of vessels.
Where analysis on a portfolio level is not currently available, my team were mandated to explore a solution.


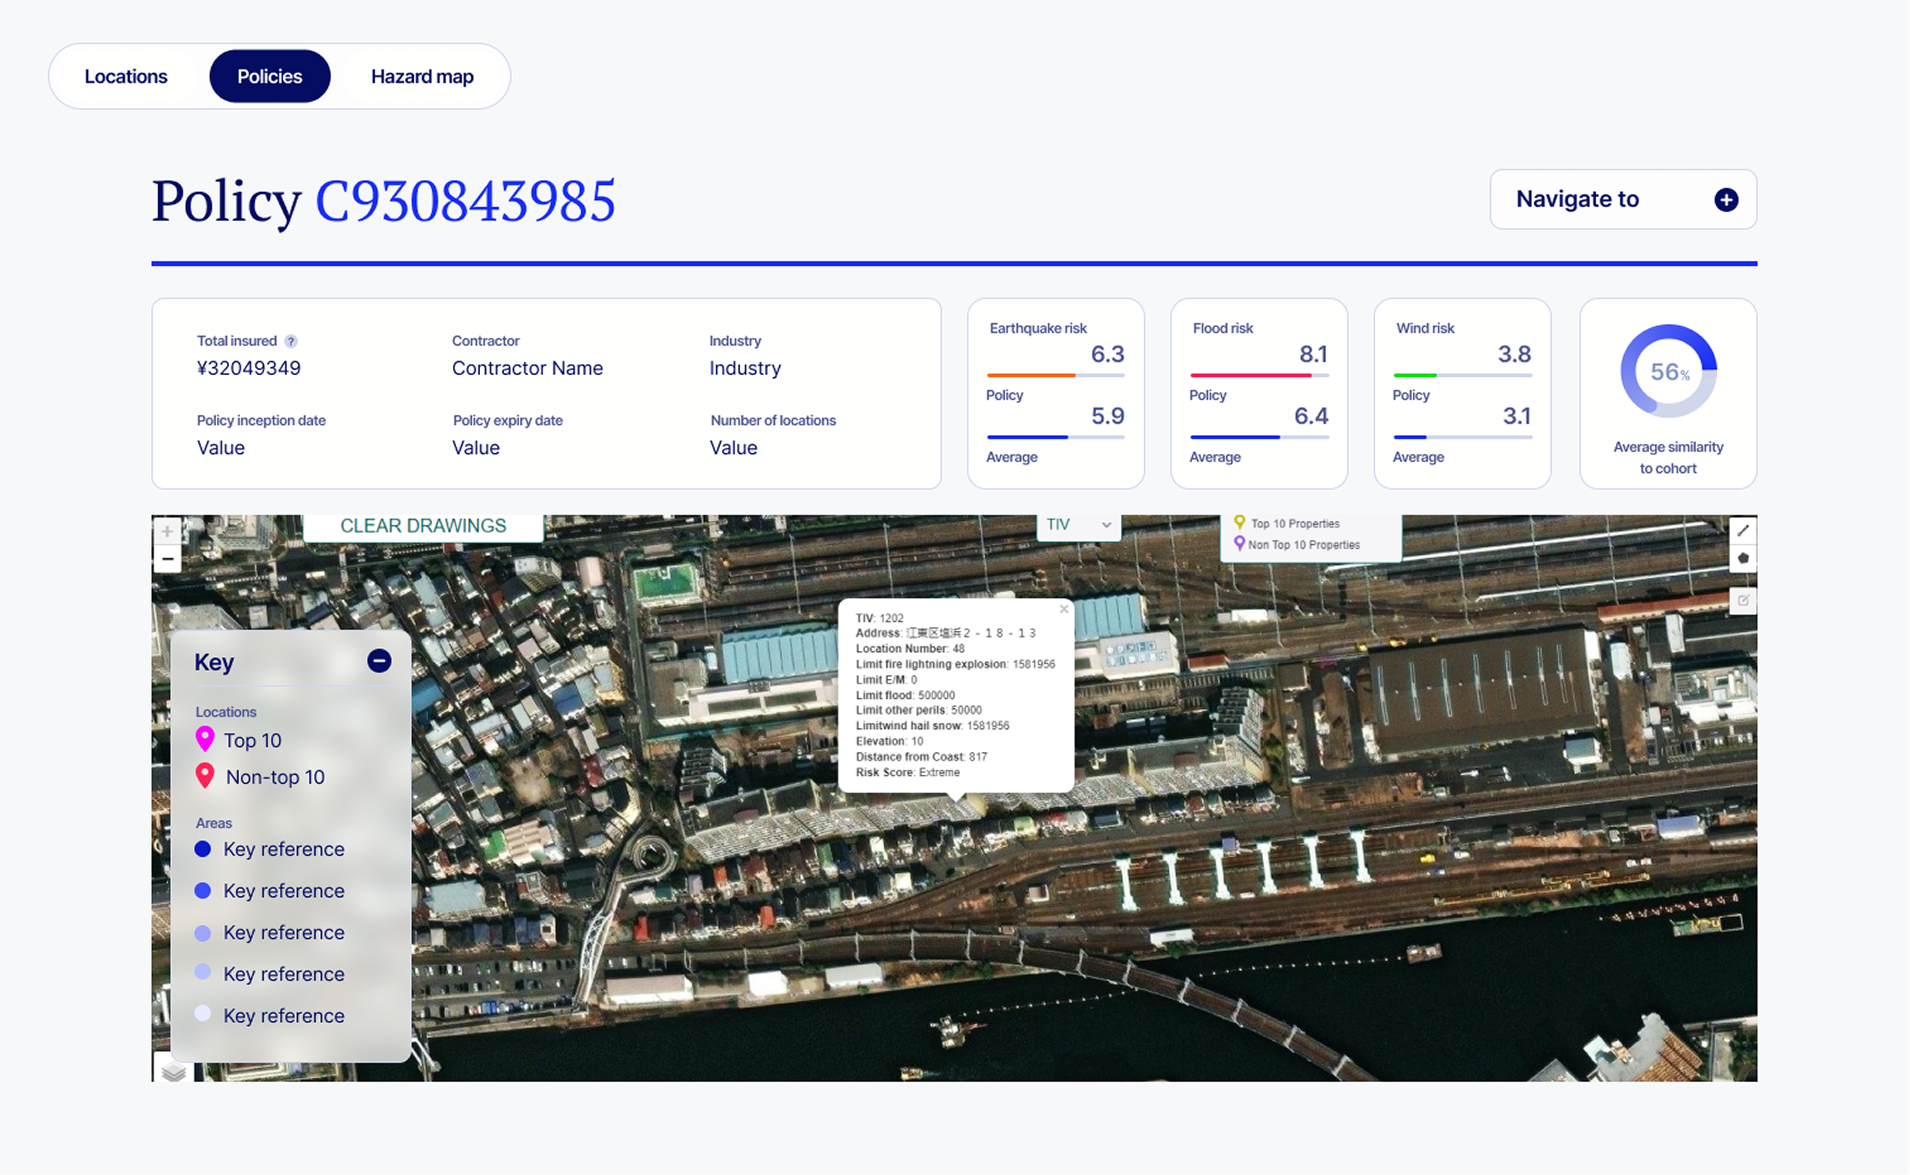
A dashboard that allows users to assess their insured vessels in the context of their entire portfolio through three different views:
All vessels from a user's portfolio are plotted on a map using live location data accurate up to the last 15 minutes. Users are able to lay active hazard locations over the map of their plotted vessels, enabling them to see where vessels have passed through and check for policy breaches. For example, a user can clearly see and is notified when a vessel passes through a war zone.

Users can get all necessary information about a singular vessel. As well as presenting insights as to where the vessel sits in context with the portfolio, the tool centralises data available on single vessels, eradicating the need to use multiple tools in their analysis.

A dashboard for users to perform analysis on their marine portfolio as a whole


The quality of internal data regarding insured assets is a recurring painpoint. Though the tool has many effective elements that rely on public data, a lot of the value-adding features of the tool rely on internal data. Information such as claims history and insured totals is scattered and varies between different teams. Many of the features of this tool require the users to have a historically consistent approach to storing information in order to be able to cross analyse between different insured assets. In order to ensure these features would go live, a lot of manual work had to cleanse the data to be used efficiently.
Users are easily able to analyse vessels on both a singular and a portfolio level. Where previously, users had to cross reference multiple spreadsheets of their personal portfolio with online tools, they are now able to use a dashboard that utilises AI to present smart insights on their portfolio. Insurers are able to keep track of, analyse and balance out their portfolios easier and faster than ever by using this smart and engaging platform.
2025
Insurtech product
Sole UX/UI Designer
Click to view case study
2021
D2C App
Sole UX/UI Designer
Click to view case study

2025
Insurtech product
Sole UX/UI Designer
Click to view case study
2025
UX Resource
UX lead
Click to explore

2025
Website
Frontend and UX Lead
Click to explore the website
2025
Website
Frontend and UX Lead
Click to explore the website
2025
Website
UX and Frontend Consultancy
Click to explore the website